GIS + Emergency Analytics
Geospatial Analytics Platform for Fire Operations Optimization
Durham Fire Compass combines incident intelligence, GIS network modeling, station workload analysis, and community growth data into a unified decision-support platform for Durham Fire Department.
Response Planning
Analyze travel time, station reach, response coverage, and service accessibility across Durham City using GIS network analysis and spatial coverage modeling.
Operational Analysis
Evaluate station workload, apparatus utilization, incident volume, and shift-based demand to identify operational pressure and resource imbalance.
Coverage Modeling
Identify service gaps and simulate response scenarios using shifting apparatus inventory levels, incident trends, and spatial demand analysis.
Scenario Stress Test
What if Durham faced a major disaster tomorrow?
A large-scale fire event. A sudden flood. A system-wide surge that overwhelms normal response capacity.
Not in theory — but in real spatial conditions, with real stations, real travel times, and real demand pressure.
What actually happens to response coverage when the system is under stress?
And more importantly — can we measure it before it happens?
The answer is yes.
Below is a spatial view of Durham’s fire and EMS response network.

Durham, North Carolina
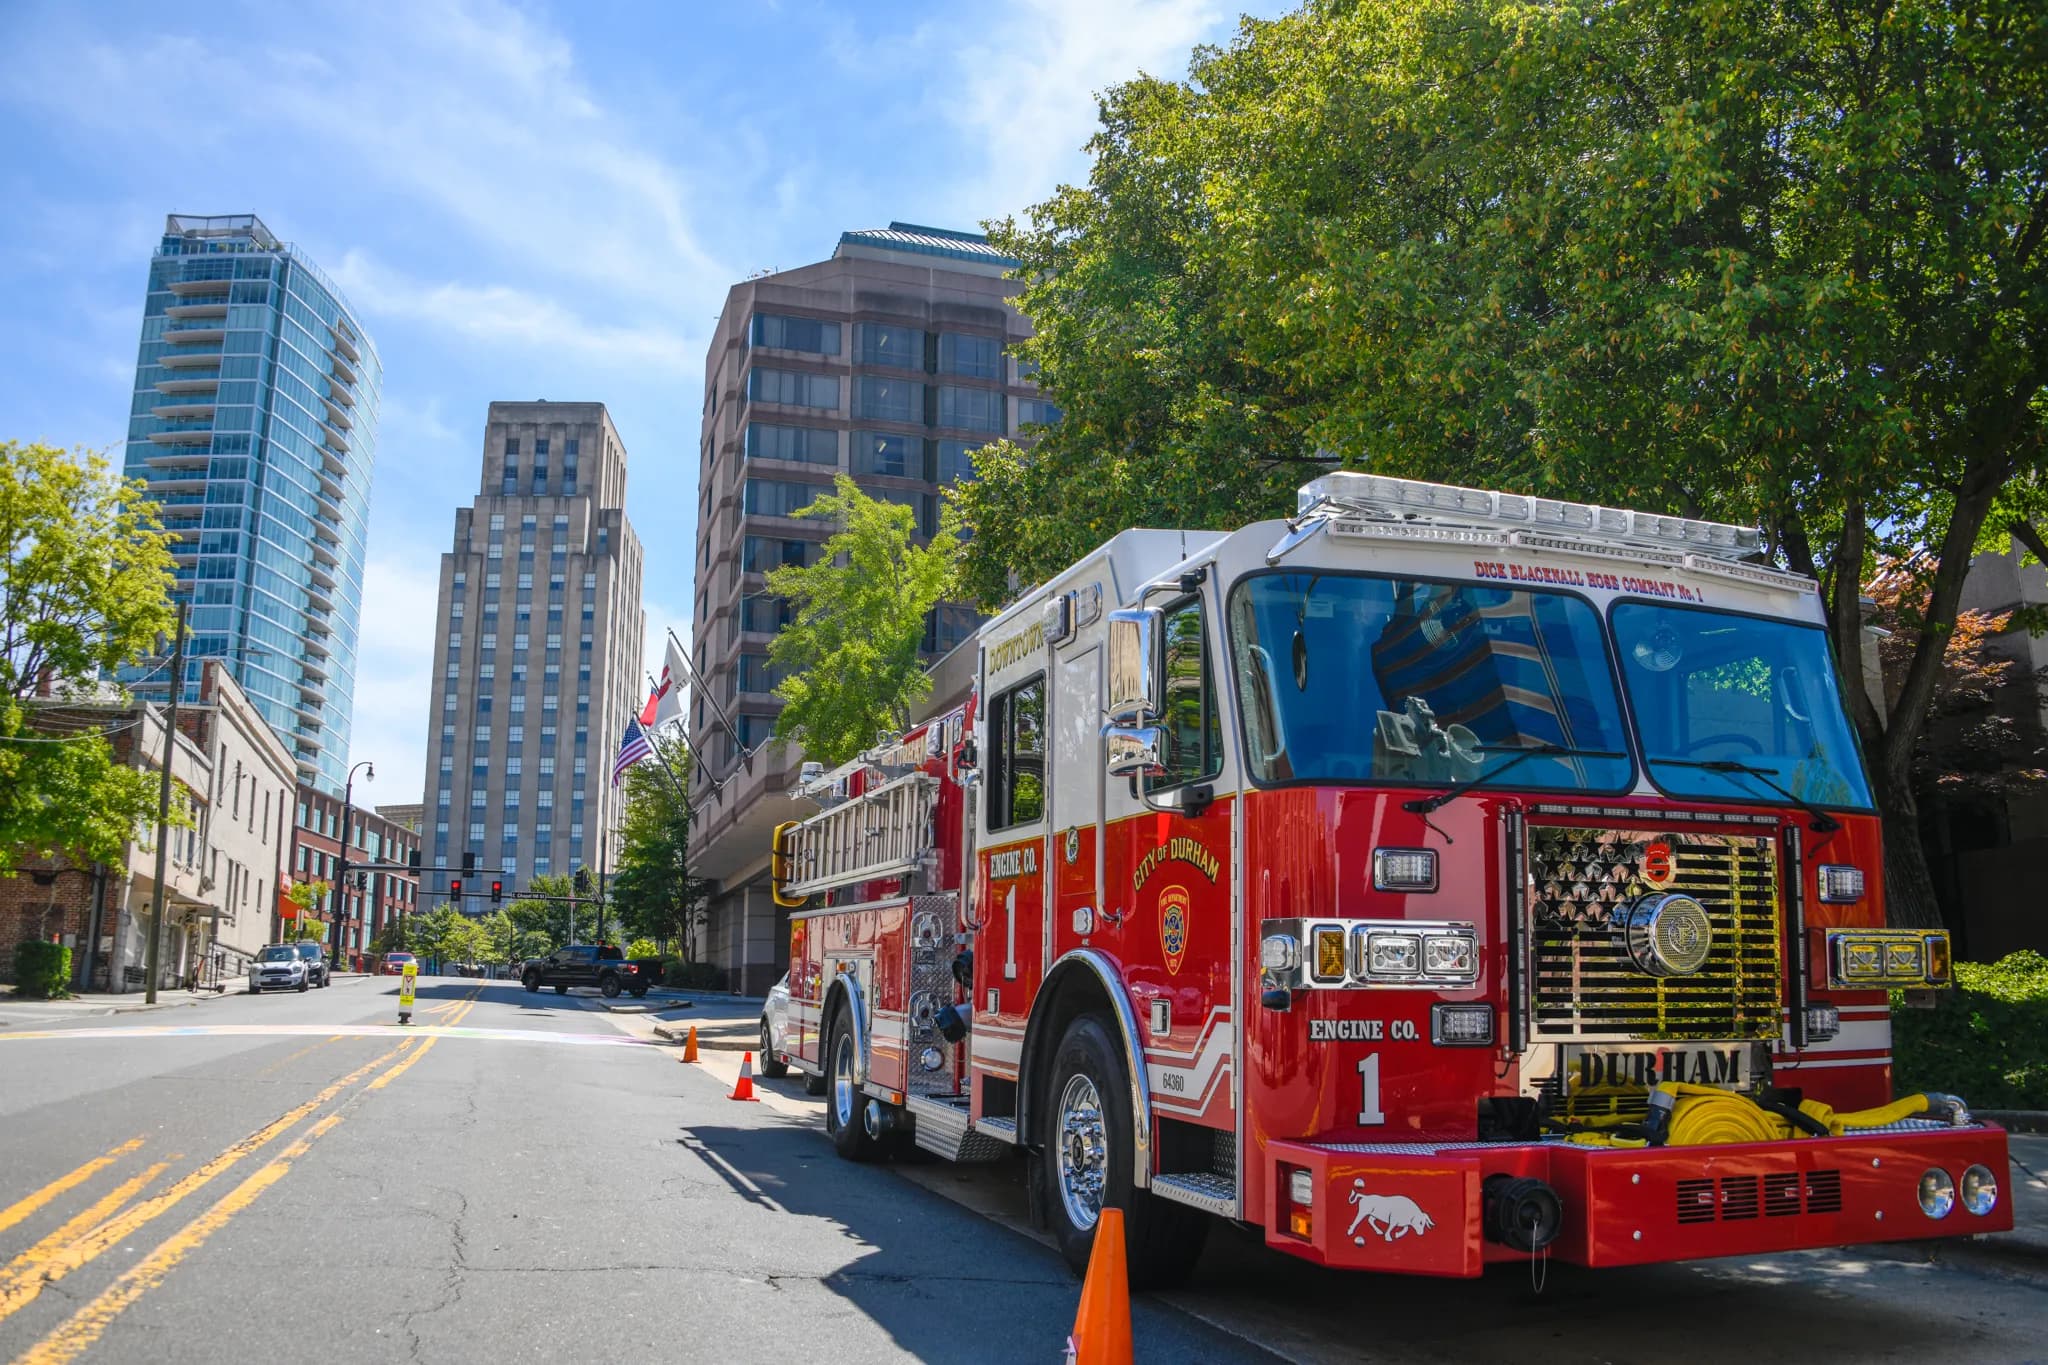
Durham Fire Overview
Operational Structure
Four battalions. Three shifts. One continuous citywide response system.
Durham Fire Department operates through rotating A, B, and C shifts. Each shift is led by a Division Chief and supported by four Battalion Chiefs, each responsible for one of the city’s battalions, while station crews—Captains, Drivers, and Firefighters—deliver day-to-day emergency response.
Dataset Window
Time boundary
ACTIVE
Aug 1, 2025→Jul 31, 2026
Twelve full months of the most recent data, updated on a monthly basis shortly after month-end to ensure insights reflect latest trends and patterns. August 2026 data pending release.
Compass Modules
Ready for more? Select a module to inspect its spatial and operational analytics
Active Module
Demand
What is happening in incidents across the city?
Aggregates fire and EMS incidents by time, shift, type group, and location to detect operational surges, peak load periods, and recurring demand hotspots across Durham.